1 什么是时空扫描统计?
扫描统计学主要用于观测多个位置上时间序列数据或事件数据,检测数据集中的异常聚集, 在scanstatistics包(Benjamin Allévius 2023)主要能实现以下功能:
首先将研究区域划分为多个位置(位置点或网格),观测每个位置上一段时间内的数据变化或事件发生情况。
然后从现在向过去延伸,在空间上选取若干位置,在时间上选取一定时间段,形成空间-时间聚集。每个聚集对应选定的位置集合和时间间隔。
对每个空间-时间聚集计算一个统计量,反映该聚集内观测到的数据或事件与预期值的差异。
报告统计量最大的几个空间-时间聚集,它们可能对应数据或事件的异常聚集。
重复这个过程,对不同的空间-时间聚集进行检验,找到研究区域内所有潜在的异常聚集。
# 使用扫描空间统计的常见步骤有:
数据资料准备。 如事件数据、时间序列数据等。数据要包含空间位置信息和测量值或事件计数信息。
设置研究区域和空间格网。根据数据空间范围设置研究区域,并在区域内划分网格。网格形状和大小根据具体研究目标确定,通常情况使用行政区划的地图。
选取空间聚集的时间窗口。从当前时间向过去延伸,选择一个或几个时间窗口,如最近1周、2周等。
在研究区域内,选择若干空间窗口和时间窗口组合,形成空间-时间聚集。每个聚集对应一组位置(空间窗口)和一段时间区间(时间窗口)。
计算每个空间-时间聚集的观测值与预期值的差异,得到聚集的统计量。统计量可直接使用观测值与预期值的差异,或基于该差异计算s标准华的差异比值等。
识别统计量最大的k个空间-时间聚集,作为潜在的异常聚集中心。k的选择根据研究目标确定,通常为3到5个。
对k个异常聚集中心,进行进一步分析,如数据动态监测、空间相关探索等,判断聚集的显著性和可能原因。
重复步骤4到步骤7,调整空间-时间聚集的设置,完成对整个研究区域的扫描检验,找到所有潜在异常聚集。
根据扫描检验结果和进一步分析,得出研究结论,识别空间聚集模式以及影响因素。
# 示例:重庆市输入性疟疾时空聚集分析
# scanstatistics包中的主要函数
## 扫描统计函数
scan_eb_poisson:最常用的函数, 基于Poisson分布模型期望值的扫描统计检测聚集时间(M. Kulldorff et al. 1998)。scan_pb_poisson: 基于总体值(M. Kulldorff 2010).scan_eb_negbin: 基于负二项分布模型。scan_eb_zip: 基于零膨胀Poission分布模型期望值。(B. Allévius and Hhle 2017)scan_permutation:基于时间-空间置换模型。(Martin Kulldorff et al. 2005)scan_bayes_negbin: 基于贝叶斯时空扩展模型。(Neill, Moore, and Cooper 2005)
## 数据集准备
# 加载相应的包
library(sp)
library(sf)
library(lubridate)
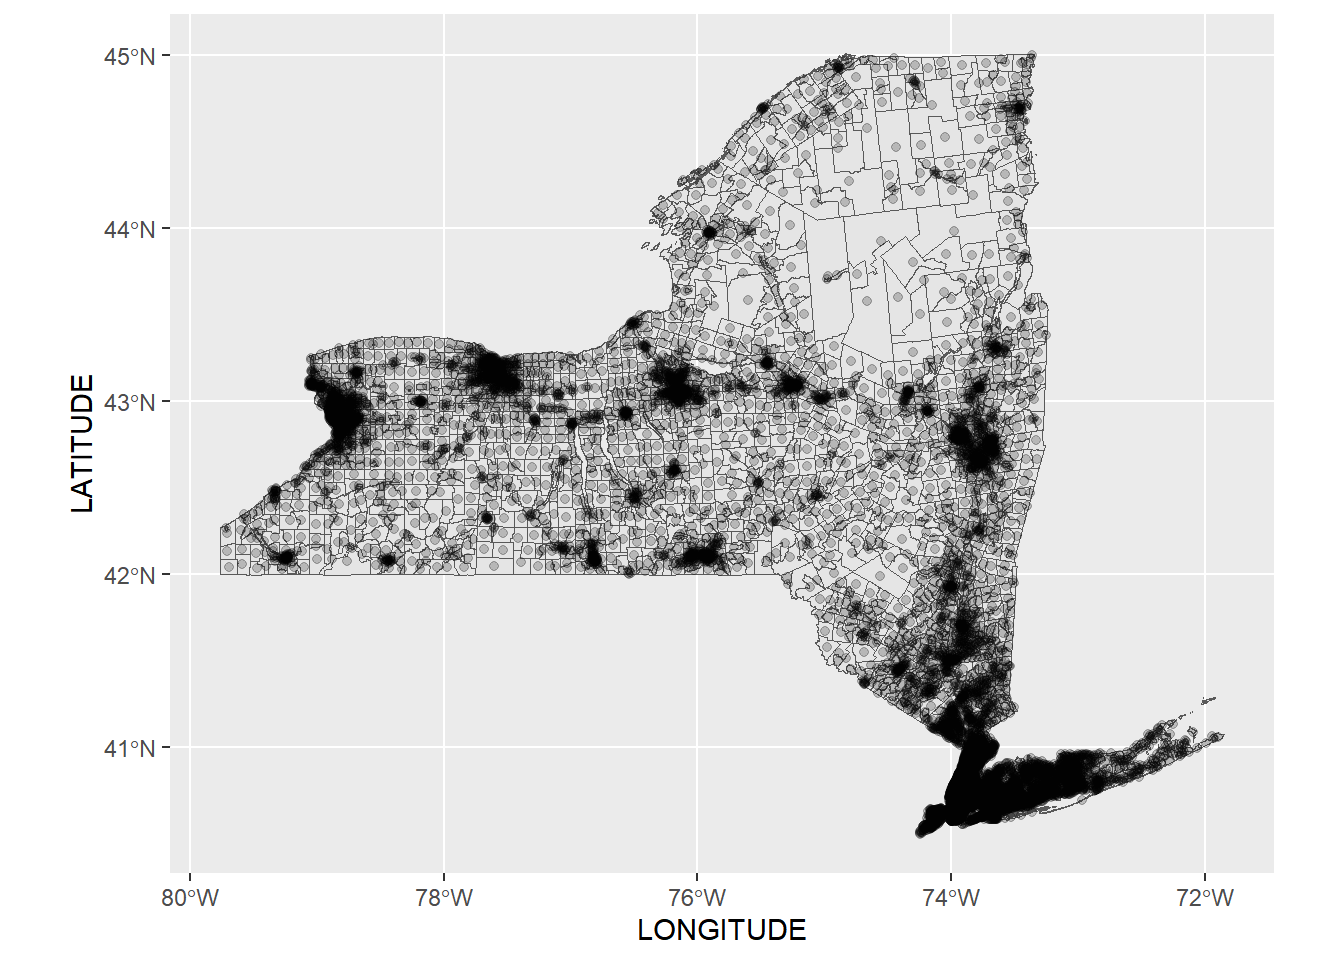
library(tidyverse)1.1 纽约的乳腺癌发病率分析
nymap <- st_read("map/NYSCancer_region.dbf")Reading layer NYSCancer_region' from data sourceC:\2023-05-22-scanstat_region.dbf’
using driver `ESRI Shapefile’
Simple feature collection with 13848 features and 77 fields
Geometry type: MULTIPOLYGON
Dimension: XY
Bounding box: xmin: -79.8 ymin: 40.5 xmax: -71.9 ymax: 45
Geodetic CRS: NAD83
nymap %>% ggplot() +
  geom_sf() +
  geom_point(aes(y = LATITUDE, x = LONGITUDE), alpha = 0.2)